
Conservation of european eel and its habitat
Common management and assessment tools for managers.

From now on
Design a strategy to obtain data for coordinated and long-term monitoring

Eel stock governance
Reinforce the cooperation between the stakeholders involved.

Eel
atlas

Obstacles
to migration

Glass eel
recruitment

Silver eel
escapement

Sampling
network

and
more...
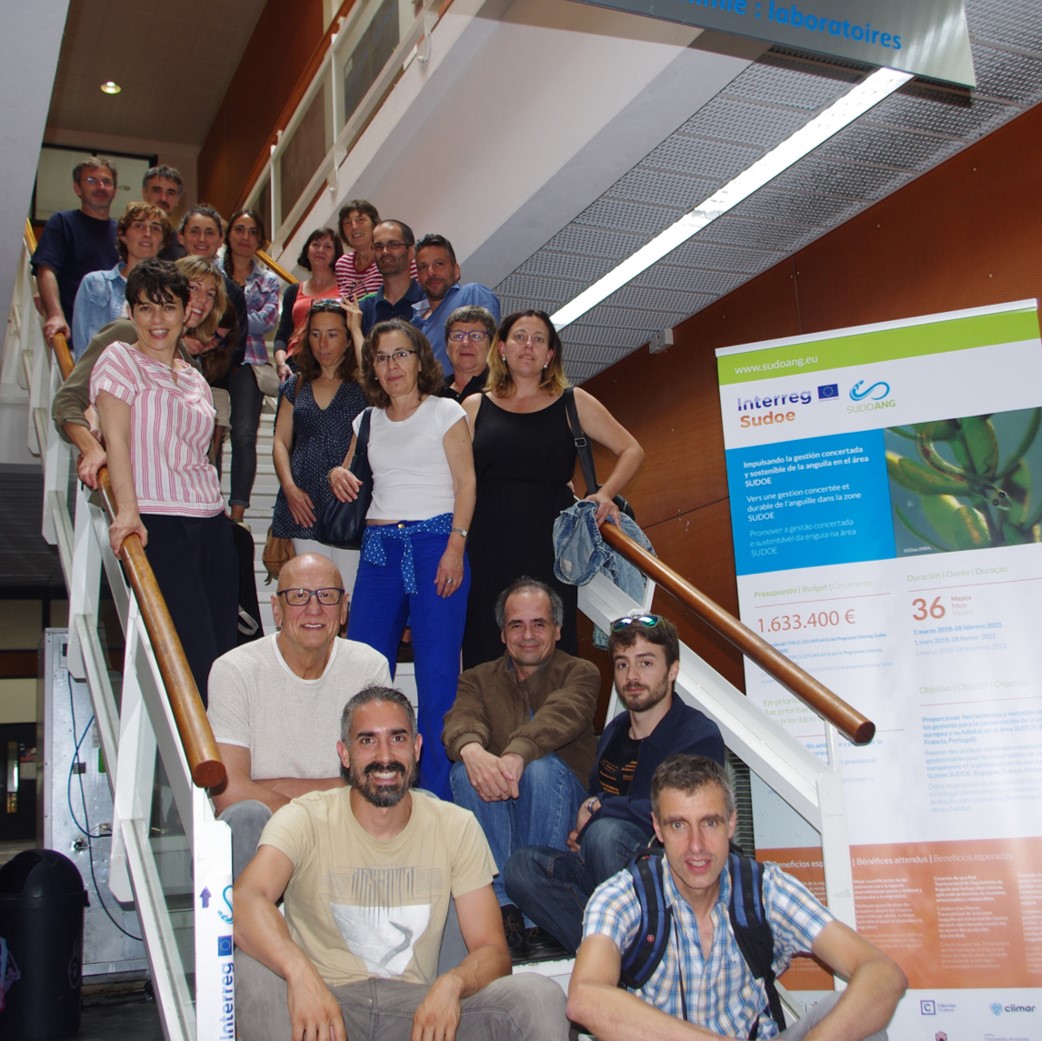
SUDOANG
VISUANG is the result of data collection and the application of models in the framework of the SUDONAG Interreg “Sudoe” project. Information on the database and the models implemented is available at www.sudoang.eu. Know the project…
Eel atlas
The present eel atlas compiles data on the estimation of eel abundance and the distribution of eel characteristics (size, biomass, sex ratio and silver) (obtained with the application of the EDA model) in the entire hydrographic network of Spain, Portugal and France.
Choose your parameters in the dropdown menu below and click on "Update view" to visualize the related information both in the map and by means of different plots. For help on the parameters click on "i".
Access to the tab browsing tutorial.
Inventory
The inventory of all dams and hydropower plants in Portugal, Spain and France is now available. The user can identify the qualitative impact of any obstacles on eel and establish priorities to improve connectivity of the river and hence eel habitat. The map below shows a cluster of dams and hydropower plants in separated layers depending on the height and the presence of a fish pass suitable for eel migration and presence of bypass, in dams and hydropower plants, respectively. These are visualizing together with the altitude of the river (m), the distance to the sea (km), the cumulated number and height of the dams available on the layers control. These dams present the current state of knowledge collated by the SUDOANG project.
When clicking on the map, clustered dams disaggregate until individual dams are shown. Click on an individual dam and realted information pops up. Dams and hydropower plant’s location may be checked with Google Maps link. Two table appear below the map with extended information related to that dam and associated hydropower plants. The plot next to them shows the cumulated number of dams below that individual dam in relation to the altitude of the river (m) and the distance to the sea (km). For help on the parameters click on "i".
Access to the tab browsing tutorial.
Mortality
This is a demonstrator for the calculation of mortalities in turbine. It uses various scenarios (flow, repartition, etc.) to provide modelled estimates of hydropower mortalities at the dam and basin level. It uses the eel production and size structure estimated in GT4.First select a basin by clicking on the map and then choose the model; options include eel repartition scenario, migration flow scenario and the opportunity to use an average mortality figure to hydropower plants where information is missing.
Click on "proceed" button to get basin wide results. In the dam results below, you will get a basin overview of mortality results. Click on a dam, either in the table or in the map to display results for that dam.
Access to the tab browsing tutorial.
1. Choose a basin and calculations options
2. Basin wide results
2. Dam results
Glass eel recruitment
Visualize the recruitment estimates made using the GEREM model in the SUDOANG project. These estimates are provided at the scale of SUDOE, eel management units, large areas defined in the model and river basins. Recruitment can be represented in different ways: absolute scale, relative scale, logarithmic scale, weighted by the surface area of the study area.
Choose your parameters in the dropdown menu below, the year from which you want to see the results and click "Update view" to see the first graph either lines or bars type. Once the recruitment estimates of your basin are generated, a table is displayed below to enter the annual catches. The plot next to it shows the exploitation rate. Both the recruitment estimates, and exploitation rates data are downloadable clicking on "Recruitment" and "Catch Rate" buttons. For help on the parameters click on "i".
Access to the tab browsing tutorial.
If you want to use Sudoang results to have an estimate of the catch rate in your area, you can provide catches (kg) in the table below and corresponding exploitation rates will be plotted. The data will not be saved and will only be used for your session to draw the diagram.
Silver eel escapement
The main results of Eel Density Analysis ( EDA ) model are shown. The EDA model extrapolates the eel characteristics collected during electrofishing surveys to the rest of the basin considering variables derived from the river segment characteristics, i.e., distance to the sea, cumulated height of dams downstream, etc., predicting eel densities and silver migration from continental waters.
The EDA model predictions are presented at different scales. They correspond to the average for the presence probability, density, sex ratio and to the sum for numbers of eels or silver eels. These estimates are provided at the scale of SUDOE, country, large areas defined in the model, Eel Management Units (EMU) and watersheds.
Choose your parameters in the dropdown menu below, the year from which you want to see the results and click "Update view" to see the first graph either lines or bars type. Escapement can be represented in different ways: absolute scale and relative scale. For help on the parameters click on "i".
Access to the tab browsing tutorial.
Sampling network
An eel monitoring network has been implemented in the SUDOE area. This network consists of 10 pilot basins (Nivelle, Oria, Nalón, Ulla, Miño, Mondego,Guadalquivir, Guadiaro, Ter and Bages-Sigean), which are representative of the different ecosystems existing in the region, both Mediterranean and Atlantic. The sampling of eel population parameters was carried out simultaneously, for two years (2018 and 2019) by trained people who applied the common protocols defined within the project. This sampling database compiling all the information collected during the monitoring of the pilot basins (recruitment, escapement and age of eels) was used in the GEREM (GT3) and EDA (GT4) models, which can be viewed here.
Choose the type of sampling in the dropdown menu below and click on "Update view" to visualize the related information.
Access to the tab browsing tutorial.
What is SUDOANG?

SUDOANG project is part of the Sudoe Programme 2014-2020 included within the European Territorial Cooperation initiative (Interreg), which promotes transnational cooperation and supports regional development in Southwestern Europe. It is financed through the European Regional Development Fund Regulation contributing to the delivery of the Europe 2020 strategy for smart, sustainable, and inclusive growth. The programme has five priority axis and SUDOANG project aligns with the Environment and resource efficiency concern, which aims not only to protect the marked rural isolation, the great biodiversity, and the extremely rich natural and cultural heritage of the Sudoe space, but also to be encouraged as to making use of it and contributing to local development in a sustainable manner by joint strategies for the protection and restoration of ecosystems and the integrated management of resources and natural areas.
Indeed, the objective of SUDOANG project is promoting concerted and sustainable European eel management in the Sudoe space. The motivation of the project is that the European eel is outside safe biological limits (ICES, 2020) and critically endangered (IUCN, 2014). It is threatened by climate change, barriers to migration, pollution, unsustainable exploitation and illegal fishing and trade. Although Member States developed eel management plans in 2010 to accomplish with the regulation (EC 1100/2007), the stock has shown no signs of recovery. In fact, the management of the stock is hampered by various factors: there is a lack of knowledge about the species to obtain a reliable estimation of biological indicators. Moreover, these indicators are obtained following different methodologies depending on the country and even the region, and in many cases are based on extrapolations of values from other regions. This means that the European eel, even being a single stock, is managed at national and regional level as if it constituted isolated populations that meet the administrative boundaries. In addition, the lack of dialogue among the diversity of the actors involved in eel conservation both at different scale, i.e., local, regional, and national, and typology, i.e., scientists, managers, fishermen and NGOs, suggests that implemented management measures do not add up the common goal of the species recovery.
In response to that, SUDOANG project includes members from research institutes, universities, conservation agencies and citizen participation foundations through Sudoe area in association with administrations, fishermen, conservation societies and control forces. Their commitment in the project lies in achieving joint tools and methods to support the conservation of the European eel and its habitat in the Sudoe area, to provide them to managers so that they make decisions based on better scientific evidence and in a more concerted manner. SUDOANG project explores as well new management approaches that will result in a proposed platform of governance to achieve concerted and effective management of eel that is not possible with the current approach.


Agence Française pour la Biodiversitè - pôle R&D Rennes| Agència Catalana del I’Aigua| Agência Portuguesa do Ambiente| Aquamuseu do Rio Minho| Association du Grand Littoral Atlantique - AGLIA | Autoridad Administrativa CITES España | CNRS Délégation Languedoc-Roussillon | Comité Regional des Pêches Marines et des Élevages Marins d’Occitanie | Consejería de Medio Ambiente y Ordenación del Territorio de la Junta de Andalucía | Consorci del Ter | Diputación Foral de Gipuzkoa | Direção-Geral de Recursos Naturais Segurança e Serviços Marítimos | Dirección de Pesca y Agricultura del Gobierno Vasco | Dirección General del Agua- MAPAMA | Dirección General de Pesca Marítima del Principado de Asturias | Dirección General de Pesca y Alimentación del Gobierno de Cantabria | DREAL Auvergne-Rhône-Alpes, Délégation de bassin-Rhône-Méditerranée | DREAL Nouvellel Auitaine | DREAL Occitanie| Federación de Cofradías de Pescadores del Principado de Asturias | Guarda Nacional Republicana | Instituto da Conservaçâo da Natureza e das Florestas | MARE - Centro de Ciências do mar e do Ambiente | Ríos con Vida | Secretaría da Dirección Xeral de Conservación da Natureza Xunta de Galicia | Secretaría General de Pesca – MAPAMA | Servicio de Protección de la Naturaleza de la Guardia Civil – SEPRONA| Sociedad Ibérica de Ictiología – SIBIC.
Additional information
Final version of the Eda2.3 database and instructions to download it; EDA2.3.
The visualization of the SUDOANG Eel Database on eel abundance and the hydrographic network in Spain, Portugal and France; Eel Atlas.
A method to estimate the width of the rivers using electrofishing data, satellite data and MERIT Hydro in Spain and Portugal.; Width script.
A method to join the river network and the waterbodies using different data sources in Spain, Portugal and France; Surface script.
Easy user manual to navigate through the VISUANG web application: User manual.
CONTACT US
